Sellside Liquidity
Chapter 2 — Sellside Liquidity
1. Definition
Sellside liquidity is the population of resting sell orders sitting below the current price. [LQ-02]
As in Chapter 1, that is a description of orders and not of a level. Draw a line at an old low if it helps you remember where to look, but the line is your bookmark. The liquidity is the orders — whose they are, why they are there, and what happens when price arrives.
This chapter is the mirror of Chapter 1 and it assumes you have read nothing, including that chapter. Everything you need is restated here.
2. Institutional reasoning
Two sources, one region
Sell orders below price come from two different people who want opposite things.
The stops of long positions. Somebody bought, expecting price to rise. To limit the damage if they are wrong, they place a protective stop below their entry. A stop on a long position is a sell order — it has to be, because closing a long means selling what you bought. That trader does not want it filled.
The breakdown orders of sellers. Somebody else is waiting for price to break an old low before committing. They place a sell order below that low, because they want to be short only if price gets there. That trader is hoping it fills.
One is defending a loss, the other is opening a position. Their intentions are opposite and their orders are identical: sell, below current price, in the same region.
Why a large buyer cares
Suppose an institution needs to buy a genuinely large position — more than the market will supply at the current price without running away from it.
It needs sellers. Not one; a concentration of them, all willing to sell at roughly the same place. And there is exactly such a concentration sitting below price, made of stops and breakdown orders that fire automatically when reached.
Price moving down into sellside liquidity is what makes a large purchase possible. The selling triggered down there is the other side of the trade.
So read the direction carefully: price falling into an old low is not automatically weakness. It may be the delivery that lets somebody buy. That is the same inversion Chapter 1 makes about rallies, pointed the other way.
Where the mirror stops
The mechanism is symmetric. Reverse every word in Chapter 1 and you get this chapter, and nothing in the reasoning above is a special case.
The behaviour may not be symmetric, and that is a different claim. Traders have long observed that markets fall differently from the way they rise: a decline reaching a cluster of long stops can cascade, because each stop that fires is a sell order pushing price into the next one, while a rally into breakout buying is more often a chase that runs out of participants. If that is real, sellside and buyside penetrations would not look alike.
Driips has not measured it. That is vocabulary you will meet elsewhere, recorded so you recognise it — not a finding, and not something the registry holds. Section 10 puts it in a form somebody could answer.
The mechanism mirrors; whether the behaviour mirrors is open.
3. Recognition
What makes a region identifiable
Orders do not collect at arbitrary prices. They collect where traders can see something, and what they see is structure.
This concept depends on MS-01, the swing point. Below price, the relevant one is a swing low: a low with higher lows on either side of it — a visible turning point. Two traders looking at the same chart will pick out the same swing low. They will not independently pick the same random price.
Structure makes a location identifiable, and identifiable locations are where orders collect. Sellside liquidity does not rest below price generally. It rests below the lows that people can name.
The shapes, named here and taught later
| Shape | What it is | Where |
|---|---|---|
| LQ-04 Old high and old low | A single prior low with orders below it | Ch. 4 |
| LQ-05 Equal highs and equal lows | Two or more lows at nearly the same price | Ch. 5 |
| LQ-11 Stop run | The event of a cluster of stops being taken | Ch. 11 |
Recognise the population first. The distinctions get their own chapters.
The pair, and what sits between
Buyside above, sellside below. Every chart has both at all times, and the region between them is where price currently is.
That pairing is what LQ-03, the liquidity pool (Chapter 3), is built on, and what the later volumes use to ask which side price is being delivered toward. This chapter does not teach that. It only makes the point that neither side means much alone — you have not finished looking until you have marked both.
The tests
- Are you looking below the current price? Sellside is below. Always.
- Is there an identifiable swing low — a low with higher lows either side — or are you marking a price you chose?
- Can you name who has orders there? Stops of longs, breakdown sellers, or both.
- Would a large buyer be able to fill there? If nothing is resting, there is nothing to buy from.
- Has the region already been traded through? Filled orders are gone.
- Have you marked the buyside side too? One side of a chart is half a reading.
4. Workflow
You are marking, not trading. This chapter contains no entry rule.
- Set your chart to New York time. Every time reference in this series is New York time.
- Working left to right, identify the swing lows — lows with higher lows on both sides.
- Mark each with a horizontal line extended to the right.
- For each, write down which orders you believe rest there: stops, breakdown entries, or both.
- Mark the buyside levels above price in a different colour. You are building a picture of both sides, not a shopping list of one.
- When price trades through a level, record what happened next — reversal, continuation, or nothing — and annotate the level as taken.
Abort conditions. Nothing is entered here. The failure to watch for is marking only the side you already have an opinion about, which turns a mapping exercise into a confirmation exercise before you have even reached a chapter with a rule in it.
5. Worked examples
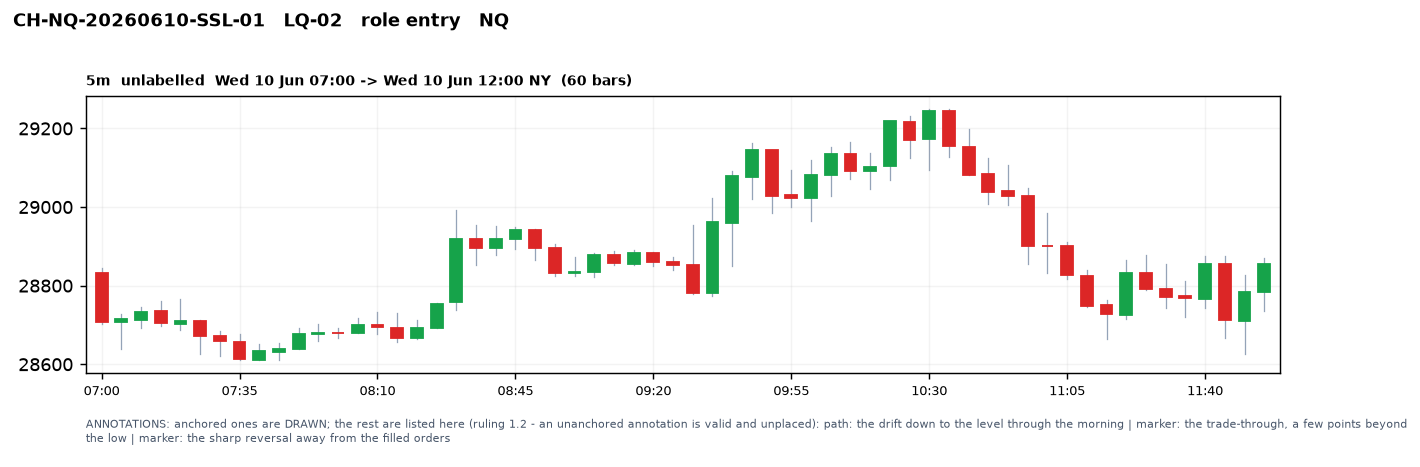
CH-NQ-20260610-SSL-01 — the population doing its job. A clear swing low sits below the current price, formed the previous session and untouched since. Price drifts down to it through the morning, trades a few points through, and reverses sharply. What was seen: an identifiable low with orders resting below it. What was done: the level marked, nothing traded. What happened: price reached the orders and turned away — the clean case.
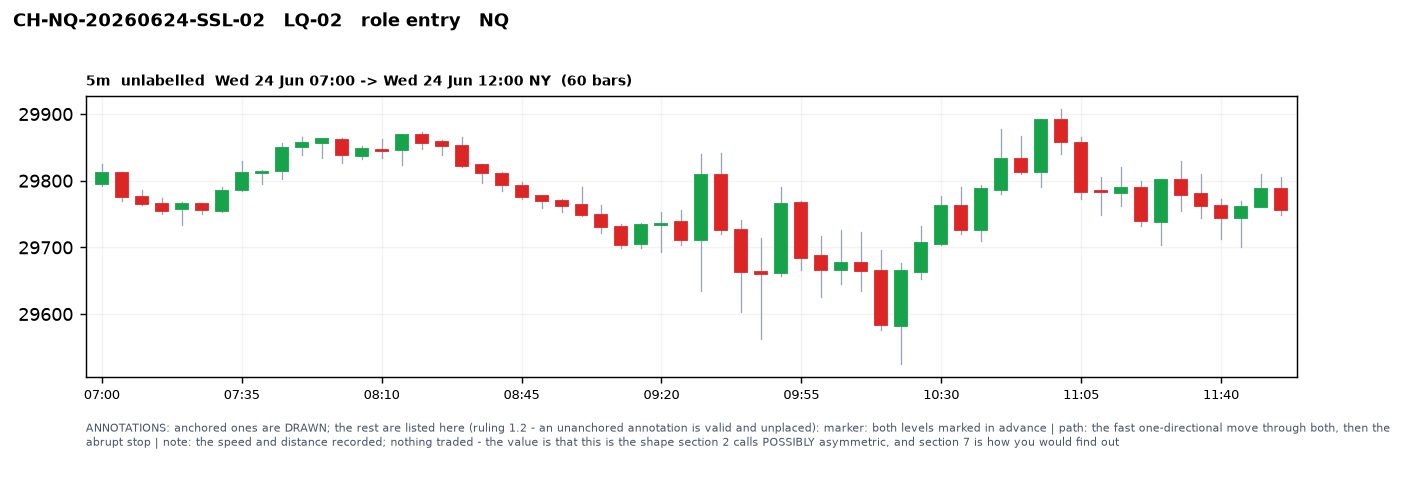
CH-NQ-20260624-SSL-02 — the cascade shape, named but not claimed. Price breaks a swing low and accelerates, running through a second low nine points lower without pausing, then stops abruptly. What was seen: a fast one-directional move through two levels rather than a reaction at the first. What was done: both levels marked in advance, the speed and distance recorded. What happened: nothing traded — the value is that this is the shape section 2 calls possibly asymmetric. One chart illustrates; section 7 is how you would find out.
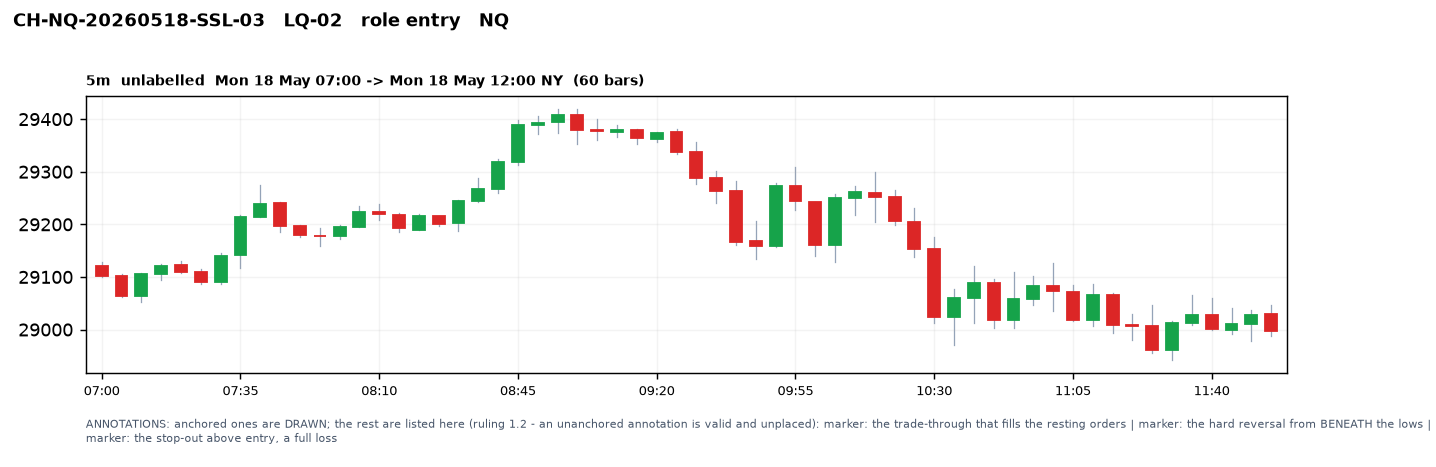
CH-NQ-20260518-SSL-03 — shorting into obvious sellside, and the loss it cost. A very clean pair of lows sits eight points below price and has held twice. It is the most obvious feature on the chart. A trader reads the approach as a breakdown about to happen and sells just above the lows. Price trades through, fills the resting orders, reverses hard from beneath them, and the position is stopped out above entry for a full loss.
The trap is precise, and it catches beginners fastest. The obvious level was obvious to everyone, which is why orders were resting there — and selling into it means adding your own sell order to the pile a large buyer is waiting to fill against. You did not use the liquidity. You became it. Being early to an obvious level is not an edge; the orders at that level are the reason the level is worth reaching.
6. Exercises
- On the last five trading days, mark every swing low on a 5-minute chart.
- For each, write one sentence naming who you believe has orders below it.
- Mark the buyside levels on the same charts in a second colour. Note how often price sat between two marked regions rather than near either.
- For every level price traded through, record what happened in the next thirty minutes: reversed, continued, or neither.
- Compare your sellside penetration outcomes with your buyside ones from Chapter 1's exercises. Write one sentence on whether they look different — and one on why five days cannot answer that.
- Find one level so obvious you would have been tempted to trade into it. Describe what you would have been supplying to whoever was waiting there.
7. Manual backtesting
| Date | Swing low marked | Approached? | Traded through? | Reaction in 30 min | Points travelled after | Normal session? |
Fill it for forty consecutive trading days on one instrument, marking levels before they are approached. A level identified afterwards is a memory, not a test.
Compute the same three numbers Chapter 1 asks for: approach rate, penetration rate, and how outcomes after penetration divide between reversal, continuation and neither.
Then do the thing Chapter 1 could not: put the two tables side by side. If sellside penetrations continue further or reverse less often than buyside ones on your instrument, you have a first measurement of the asymmetry section 2 refused to assert. If they look the same, you have evidence that the mirror holds all the way down, which is equally worth knowing and much less often said.
Forty days on each side is a first estimate. Record both sample sizes next to both results.
8. Common mistakes
- Selling into obvious sellside because it is obvious. Correction: section 5's third example. You become the liquidity.
- Reading a fall into an old low as weakness. It may be the move that lets somebody buy. Correction: hold both readings until something else decides.
- Marking only the side you have a view on. Correction: both sides, different colours, every session.
- Assuming the asymmetry is established. Cascades are vocabulary, not a Driips finding. Correction: section 7 measures it; nothing here claims it.
- Treating the line as the concept. Correction: name who has orders there or delete the level.
- Keeping levels after they are run. Filled orders are gone. Correction: annotate taken levels the same day.
9. Cross references
Depends on:
- MS-01 Swing point (Vol. 3, Ch. 1) — supplies the swing low that makes a location identifiable
Feeds — the same three lines Chapter 1 opened, from the other side:
- LQ-03 Liquidity pool (Ch. 3) — what a set of these becomes
- LQ-09 Liquidity raid (Ch. 9) — what happens when price takes one
- NR-01 Draw on liquidity (Vol. 5, Ch. 1) — what it means for direction
Closely related:
- LQ-01 Buyside liquidity (Ch. 1) — the mirror above price
- LQ-04 Old high and old low (Ch. 4), LQ-05 Equal highs and equal lows (Ch. 5) — the shapes
- LQ-11 Stop run (Ch. 11) — the event when a stop cluster below price is taken
10. Quantitative mapping
Not yet formalised. LQ-02 sits at Stage 2: operationally defined, markable on a chart, not quantitatively specified. The registry holds no quantitative-specification reference for this entry, exactly as for LQ-01.
A second gap, stated plainly because this book's honesty applies to its own records: this concept's registry entry carried no notes at all before this chapter was written. LQ-01 was seeded with a definition and a teaching instruction; LQ-02, registered in the same pass at the same release class for the same free tier, got nothing. It was found by audit rather than noticed in use, which is the part worth learning from — an empty entry is silent, and silence reads exactly like agreement.
ICT-QS candidate (a) — does marked sellside liquidity behave differently from unmarked price? Approach rate, penetration rate, and post-penetration outcomes for identifiable sellside regions on NQ, each against equivalent unmarked regions as a control. Unmeasured.
ICT-QS candidate (b) — is the mirror symmetric in behaviour? The same three measures computed on buyside and sellside regions and compared: do sellside penetrations differ in reaction rate and in follow-through distance? Unmeasured, and the more interesting of the two — candidate (a) asks whether these regions matter, while (b) asks whether the direction changes what they do. Section 7 is the manual form of both.
charts: [] stands, as across this book.
LQ-02UNEXAMINEDread the honesty sentence
Not yet formalised. LQ-02 sits at Stage 2: operationally defined, markable on a chart, not quantitatively specified.